
Show the formula and working
This solar panel output calculator shows how much electricity your solar panels make per day, per month and per year, for homes in the UK, Ireland and northern Europe. Enter the number of panels, their rating and your location, adjust for roof direction and shading, and it also shows how much the system makes on a typical June day and a typical December day.
Quick answer: Solar panel output equals system size in kWp times the yearly yield per kWp for your location. Ten 430 Wp panels (4.3 kWp) facing south in London, where PVGIS gives 1,023 kWh per kWp, make about 4,399 kWh a year: roughly 12.1 kWh a day on average, 17.2 kWh in June and 5.3 kWh in December.

What Is a Solar Panel Output Calculator?
A solar panel output calculator is a tool that estimates the energy, in kWh, a set of solar panels generates over a year, a month and a day at a given location.
The formula in plain words: system size in kWp equals the number of panels times the rating in watts peak, divided by 1,000. Multiply by the yearly yield per kWp for your location, which already includes typical losses in cables and the inverter. Then multiply by a direction and tilt factor (100% for a south facing roof at a good angle) and by one minus any shading loss. June and December figures use the PVGIS monthly split for each city.
How Do You Use the Solar Panel Output Calculator?
- Enter the number of panels.
- Enter the panel rating in Wp.
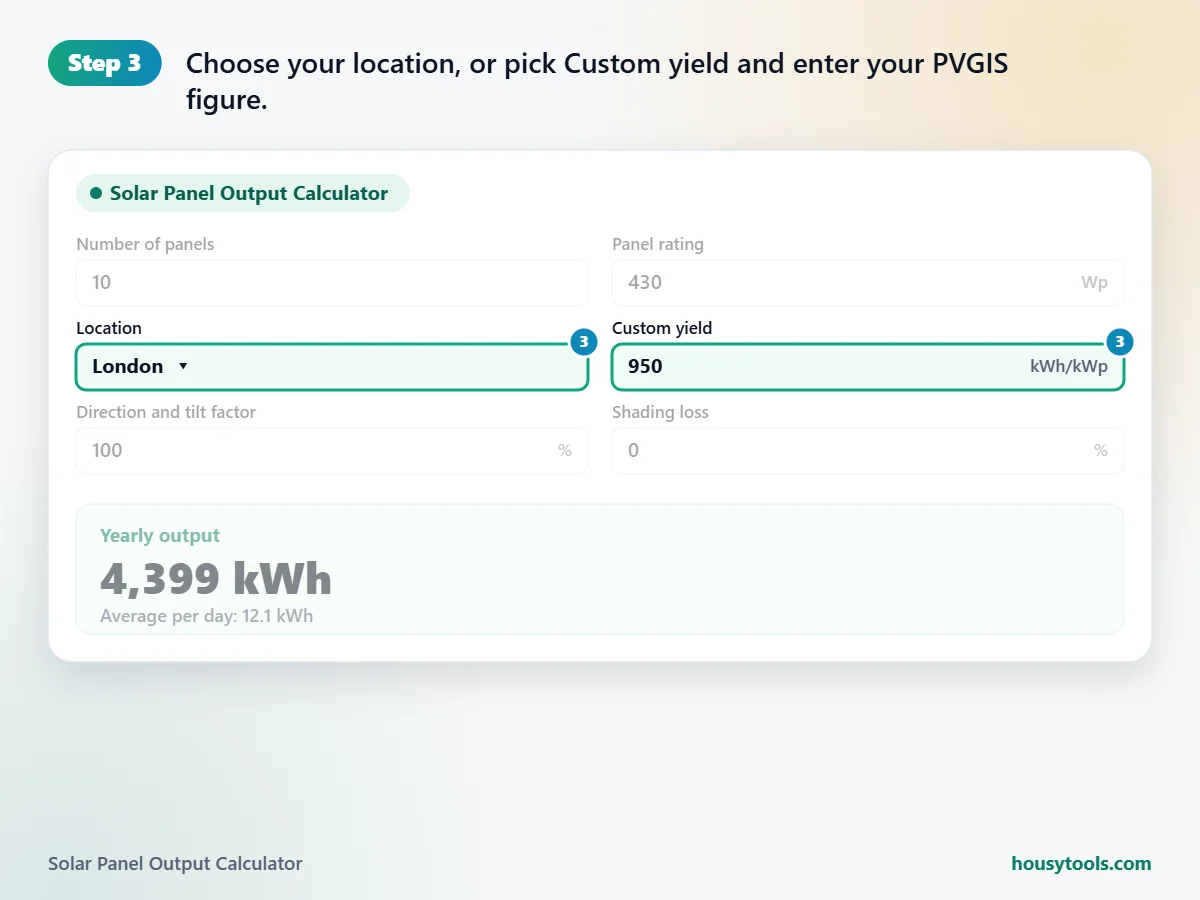
- Choose your location, or pick Custom yield and enter your PVGIS figure.
- Lower the direction and tilt factor if your roof faces east or west or is very flat.
- Add a shading loss if trees, chimneys or buildings shade the panels.
- Read the yearly output, the daily average and the June and December figures.




How Much Electricity Does a Solar Panel Produce per Day?
A 430 Wp panel facing south in London makes about 1.2 kWh a day on average over a year, but about 1.7 kWh a day in June and only about 0.5 kWh a day in December.
| Location | Yearly output | Average per day | June per day | December per day |
|---|---|---|---|---|
| London | 4,399 kWh | 12.1 kWh | 17.2 kWh | 5.3 kWh |
| Dublin | 4,248 kWh | 11.6 kWh | 16.3 kWh | 5.1 kWh |
| Amsterdam | 4,416 kWh | 12.1 kWh | 18.1 kWh | 4.0 kWh |
| Hamburg | 4,214 kWh | 11.5 kWh | 17.8 kWh | 3.3 kWh |
| Copenhagen | 4,528 kWh | 12.4 kWh | 19.9 kWh | 2.5 kWh |
| Edinburgh | 3,904 kWh | 10.7 kWh | 15.5 kWh | 3.3 kWh |

The gap between summer and winter grows the further north you go. Copenhagen makes more than London over a whole year but much less in December, because its winter days are shorter. That seasonal swing is the main reason solar alone cannot cover winter use without a large battery or a grid connection.
How Do Roof Direction and Shading Affect Output?
South facing panels at a good tilt make the most in the northern hemisphere, while east, west and very flat roofs make less, and shading can cut output sharply.
Rather than guess a percentage, use the PVGIS tool from the EU Joint Research Centre. Run it once for your roof direction and angle and once for a south facing roof at the optimum angle, divide the first yearly figure by the second, and enter the result as the direction and tilt factor. If your installer gives you an MCS generation estimate, you can instead divide it by the system size and enter it as a custom yield with the factor left at 100%.
Shading is harder to model. A tree or chimney that shades one panel for part of the day can affect the whole string on a simple inverter. Optimisers or microinverters reduce that effect, and a proper shade survey from your installer is the best guide.
What Is the Difference Between kW, kWp and kWh?
kWp is the peak power a panel array is rated at under standard test conditions, while kWh is the energy it actually makes over time.
A 4.3 kWp system rarely produces 4.3 kW, because full test conditions of 1,000 watts of sunlight per square metre at 25 °C are uncommon in northern Europe. What matters for your bill is kWh, which is why this solar panel output calculator converts kWp to kWh with a measured yield for your location. To value that output, the solar panel calculator applies your import and export rates.
Worked Example: Eight Panels on an East Roof in Dublin
Example: a house in Dublin has room for eight 435 Wp panels on an east facing roof. PVGIS shows the east roof yields about 75% of a south facing one, and a neighbour’s tree adds about 10% shading.
- Size: 8 x 435 Wp = 3.48 kWp
- Dublin yield: 988 kWh per kWp
- Factors: 75% for direction, 90% after shading
- Yearly: 3.48 x 988 x 0.75 x 0.9 = about 2,321 kWh
- Daily average: about 6.4 kWh, from about 9 kWh in June to about 2.8 kWh in December

The 75% factor in this example came from the homeowner’s own PVGIS run, not from a fixed rule, so run your own before relying on the result. To see whether that output covers your use, try the how many solar panels calculator.
Why Is My Solar Output Lower Than Expected?
Lower than expected output usually comes from weather, shading, dirt, a fault or an unrealistic estimate, so compare a full year rather than a single month.
- A dull year can be noticeably below a sunny one.
- New shading from trees or extensions reduces output every year.
- Panels lose a little output with age, about 0.5% a year on average according to NREL research on PV lifetime. The solar panel degradation calculator shows the long term effect.
- An inverter fault or tripped isolator can stop generation completely. Check the inverter app or display.
- Heavy dirt or bird droppings on low pitched roofs can block light.
Any electrical fault on the roof or inverter must be checked by a qualified solar installer.
Solar Panel Output Calculator FAQs
How many kWh does a 4 kW solar system produce per day in the UK?
In London a 4 kWp south facing system makes about 4,092 kWh a year with PVGIS yields, or about 11.2 kWh a day on average. That ranges from about 16 kWh a day in June to about 4.9 kWh in December.
How much does a 400 W solar panel produce?
A 400 W panel facing south in London makes about 409 kWh a year, or about 1.1 kWh a day on average. In Edinburgh the same panel makes about 363 kWh a year.
Do solar panels produce electricity on cloudy days?
Yes, but much less. Panels use diffuse light on cloudy days, so output drops rather than stops. Yearly yields already average sunny and cloudy days for your location.
What time of day do solar panels produce the most?
Output peaks around solar noon, when the sun is highest. East facing panels peak in the morning and west facing panels in the afternoon, which can suit homes that use more power at those times.
How accurate is a solar panel output calculator?
It is a good estimate for a typical year at your location. Real output varies with weather, shading and system faults, so compare results over a full year, not a single month.
What is a good yield per kWp in Ireland?
PVGIS gives about 988 kWh per kWp for a south facing system at the best tilt in Dublin. East, west or shaded roofs give less, so run PVGIS for your own roof.
Checked October 2026. Sources: EU Joint Research Centre PVGIS 5.3, NREL PV lifetime research.